Examining Housing Experiences by Sexual Orientation and Gender Identity
 The recent inclusion of sexual orientation and gender identification in the U.S. Census Bureau’s Household Pulse Survey allows researchers and policymakers to consider the unique experiences of LGBTQ+ households in the marketplace. Photo credit: istockphoto.com/martin-dm
Veronica Helms, Emily Molfino, and Ben Winter from HUD’s Office of Policy Development and Research discuss insights from the U.S. Census Household Pulse Survey
The social science research community has a poor track record when it comes to studying the housing experiences of the LGBTQI+ community, defined here as lesbian, gay, bisexual, transgender, queer, intersex, and individuals whose orientations differ from those who identify as heterosexual and cisgender. People who are sexual and gender minorities (SGMs) are rarely seen in national data collection efforts and social science literature. Some research, however, shows that households containing SGMs face unique challenges in economic security and basic living standards. Prior research also shows that SGMs, particularly transgender people, experience increased housing discrimination and housing insecurity throughout their lives.
Recent inclusion of sexual orientation and gender identity (SOGI) questions in the U.S. Census Bureau’s Household Pulse Survey gives researchers an opportunity to examine the intersection of SOGI, race, ethnicity, and housing status. This article introduces the housing research community to high-level findings regarding (1) the prevalence of housing insecurity among LGBTQI+ households; (2) the intersection of race, ethnicity, and LGBTQI+ household status when examining housing insecurity; and (3) the extent to which HUD programs serve the LGBTQI+ community. Although these analyses are subject to some limitations, they represent HUD’s first estimates of housing insecurity among LGBTQI+ households.
We hope these findings will encourage researchers to further explore the intersections of SOGI, race, ethnicity, and housing status. More research in this space can help ensure equitable access to the housing safety net (as well as equal outcomes) for this historically marginalized population that policymakers too often overlook.
Housing Insecurity + SOGI
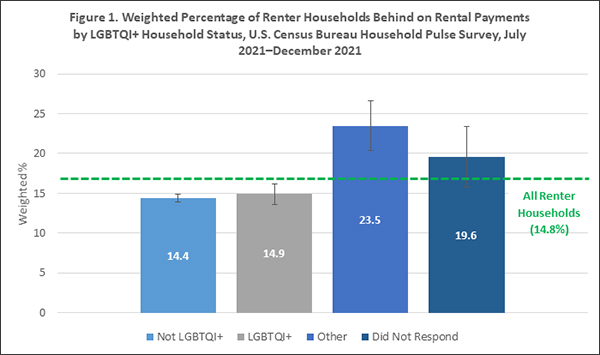
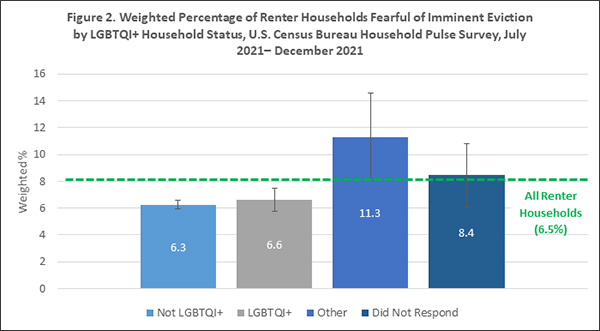
According to the U.S. Census Bureau’s Household Pulse Survey, approximately 15.4 percent of all U.S. renter households, or 6.9 million households, are LGBTQI+, meaning that the respondent self-identified as SGM. To better understand housing insecurity among this population, we examined the relationship between self-reported SOGI responses and two housing insecurity metrics: (1) behind on rent and (2) fearful of imminent eviction (Figure 1 and Figure 2). Key findings include the following:
- LGBTQI+ and non-LGBTQI+ households experienced similar rates of housing insecurity. Housing insecurity rates for these two populations were approximately the same as those in the general U.S. renter population.
- Households with respondents who reported “other” for SOGI variables had the highest rates of housing insecurity; these individuals do not identify with the sexual orientation or gender identity categories presented in the Household Pulse Survey. Because this group experiences high rates of housing insecurity, more research on this population is needed.
- Households with respondents who chose not to answer SOGI questions had higher rates of housing insecurity than did LGBTQI+ and non-LGBTQI+ households. Assuming there is a pattern behind why a respondent chose not to respond to these questions, this finding suggests a strong nonresponse bias when using the Household Pulse Survey data for this special population.
Housing Insecurity + Race/Ethnicity
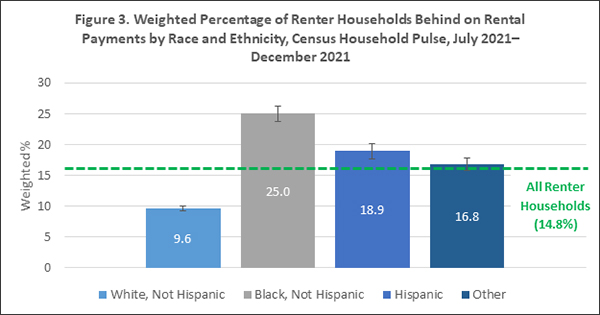
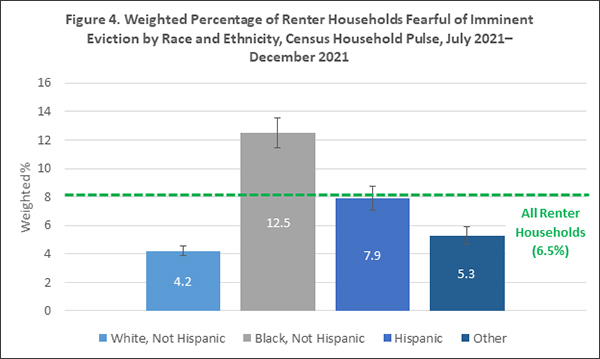
A large body of research finds significant racial and ethnic disparities in rates of housing insecurity. During the pandemic, people of color experienced the highest rates of housing insecurity. To illustrate the breadth of this disparity, we examined the relationship between self-reported race and ethnicity responses and two housing insecurity metrics: (1) behind on rent and (2) fearful of imminent eviction (Figure 3 and Figure 4). Key findings include the following:
- Black, non-Hispanic respondents living in renter households had the highest rates of housing insecurity: 25 percent were behind on rent, and 12.5 percent were fearful of imminent eviction.
- White, non-Hispanic respondents living in renter households had the lowest rates of housing insecurity: 9.6 percent were behind on rent, and 4.2 percent were fearful of imminent eviction.
Housing Insecurity + Race/Ethnicity + SOGI
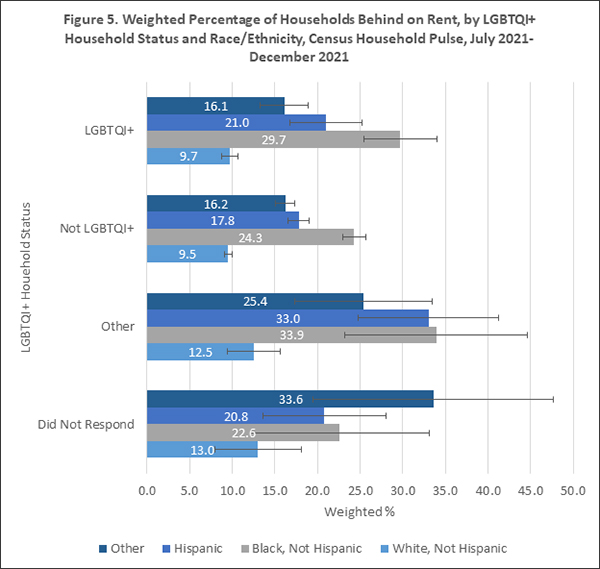
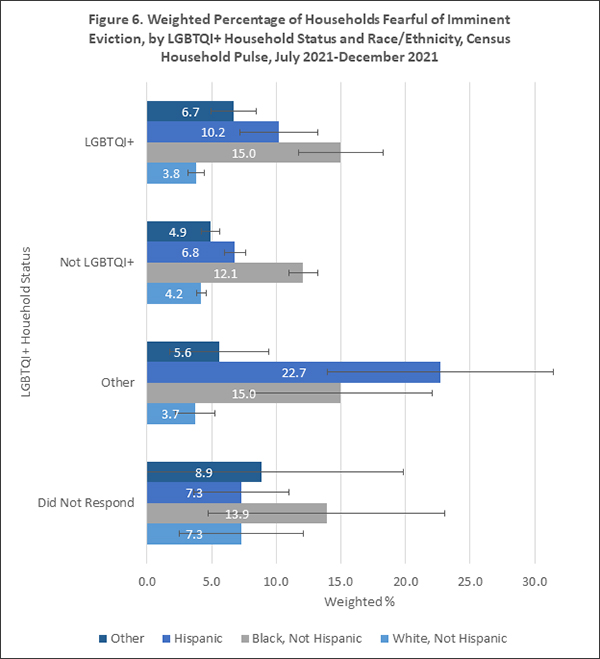
We also examined housing insecurity by cross-tabulated SOGI and race/ethnicity categories to better understand the intersections of race, ethnicity, SOGI, and housing insecurity. Because cross-tabulation resulted in several groupings, we examined the behind on rent and fearful of imminent eviction metrics separately. Key findings include the following:
- Housing insecurity metrics were higher for LGBTQI+ black and Hispanic renter households than for their non-LGBTQI+ black and Hispanic counterparts. LGBTQI+ white renters exhibited housing insecurity rates similar to those of their non-LBGTQI+ counterparts.
- Among LGBTQI+ renter households, nearly 30 percent of black, non-Hispanic respondents reported being behind on rent compared with 9.7 percent of white, non-Hispanic households and 21 percent of Hispanic households.
- Among renter households not identifying as LGBTQI+, racial and ethnic disparities were similar to those of the general renter population.
- Although the sample size is limited, respondents who identified as “other” on SOGI questions faced the highest rates of housing insecurity. Rates were elevated for all racial and ethnic groups. Similarly, those who chose not to respond to SOGI questions had similarly high rates of housing insecurity, yet racial and ethnic gaps persisted.
HUD-supported Housing Assistance + SOGI
HUD analysts successfully linked Household Pulse Survey SOGI data with administrative data on HUD’s three largest rental assistance programs: public housing, vouchers, and multifamily housing. Because HUD’s administrative data systems do not collect SOGI data, this analysis provides the Department’s first estimate of LGBTQI+ households receiving HUD assistance.
One key finding from this research is that renter households and HUD-assisted households demonstrate a similar prevalence of LGBTQI+ households. LGBTQI+ households make up approximately 15 percent of all U.S. renter households and approximately 12 percent of HUD-assisted renter households (Table 1). This finding suggests that, at the national level, HUD’s housing programs may not pose a significant barrier to entry for LGBTQI+ households. More research is needed, however, to determine whether the take-up rate for LGBTQI+ households is consistent across different regions or market typologies (such as rural versus urban areas). More research is also needed to determine whether LGBTQI+ households who do receive assistance experience outcomes similar to those of non-LGBTQI+ households receiving assistance, such as in the length of assistance and the ability to access high-quality neighborhoods with HUD assistance.
| Table 1. Distribution of Pulse Respondent Characteristics by Renter Household Status | ||||
|---|---|---|---|---|
| Characteristic of the Pulse Respondent | All U.S. Renter Households | HUD-Assisted Households | ||
| Weighted % | 90% Confidence Interval | Weighted % | 90% Confidence Interval | Race and Ethnicity |
| White, not Hispanic | 54.5 | 0.5 | 28.2 | 2.2 |
| Black, not Hispanic | 18.2 | 0.5 | 45.5 | 3.7 |
| Hispanic | 18.7 | 0.4 | 20.3 | 3.1 |
| Other, not Hispanic | 8.6 | 0.2 | 6.0 | 1.0 | LGBTQI+ |
| Not LGBTQI+ | 81.4 | 0.4 | 84.3 | 3.4 |
| LGBTQI+ | 15.1 | 0.4 | 12.0 | 2.7 |
| Other | 2.0 | 0.1 | 1.8 | 0.9 |
| Did not respond | 1.5 | 0.2 | 1.8 | 1.3 |
| Source: U.S. Census Bureau Household Pulse Survey 2021 (Weeks 34–40) linked with HUD 2021 administrative data on public and assisted housing programs. The U.S. Census Bureau reviewed this data product for unauthorized disclosure of confidential information and approved the disclosure avoidance practices applied to this release. CBDRB-FY22-POP001-0058. | ||||
Recognizing the important role of intersectionality, we also examined race, ethnicity, and LGBTQI+ household status among all renter households and HUD-assisted households. Several key findings emerged, including the following:
- The distribution of LGBTQI+ households by race and ethnicity was similar for HUD-assisted households and all renter households; however, more research is needed to confirm this finding.
- An estimated 10 percent of black, non-Hispanic LGBTQI+ renter households live in public and assisted housing. An estimated 90 percent of black LGBTQI+ households live in unassisted housing stock.
- An estimated 5 percent of Hispanic, LGBTQI+ renter households live in public and assisted housing. An estimated 95 percent of Hispanic LGBTQI+ households live in unassisted housing stock.
| Table 2. Percentage of Pulse Respondent Households Living in HUD-Assisted Housing by Characteristic | ||
|---|---|---|
| Characteristic of the Pulse Respondent | Weighted % | 90% Confidence Interval | Race and Ethnicity |
| White, not Hispanic | 2.1 | 0.1 |
| Black, not Hispanic | 10.1 | 1.1 |
| Hispanic | 4.4 | 0.7 |
| Other, not Hispanic | 2.8 | 0.5 | LGBTQI+ |
| Not LGBTQI+ | 4.2 | 0.3 |
| LGBTQI+ | 3.2 | 0.7 |
| Other | 3.7 | 1.8 |
| Did not respond | 4.8 | 3.3 | Race and Ethnicity + LGBTQI+ Household Status |
| Race and Ethnicity and Not LGBTQI+ | ||
| White, not Hispanic | 2.2 | 0.2 |
| Black, not Hispanic | 10.2 | 1.1 |
| Hispanic | 4.2 | 0.8 |
| Other, not Hispanic | 2.9 | 0.6 | Race and Ethnicity and LGBTQI+ |
| White, not Hispanic | 1.5 | 0.2 |
| Black, not Hispanic | 9.7 | 4.2 |
| Hispanic | 4.8 | 1.8 |
| Other, not Hispanic | 2.6 | 1.4 | Race and Ethnicity and Other |
| White, not Hispanic | 2.7 | 1.5 |
| Black, not Hispanic | 10.5 | 0.5 |
| Hispanic | 3.3 | 0.0 |
| Other, not Hispanic | 0.6 | 0.1 | Race and Ethnicity and Did Not Respond to LGBTQI+r |
| White, not Hispanic | 2.5 | 0.9 |
| Black, not Hispanic | 4.2 | 2.4 |
| Hispanic | 7.8 | 8.2 |
| Other, not Hispanic | 2.6 | 2.0 |
| Source: U.S. Census Bureau Household Pulse Survey 2021 (Weeks 34–40) linked with HUD 2021 administrative data on public and assisted housing programs. The U.S. Census Bureau reviewed this data product for unauthorized disclosure of confidential information and approved the disclosure avoidance practices applied to this release. CBDRB-FY22-POP001-0058. | ||
| Table 3. Distribution of Pulse Respondent Characteristics by Renter Household Status | ||||
|---|---|---|---|---|
| Characteristic of the Pulse Respondent | U.S. Renter Households | HUD-Assisted Households | ||
| Weighted % | 90% Confidence Interval | Weighted % | 90% Confidence Interval | Race and Ethnicity and Not LGBTQI+ |
| White, not Hispanic | 44.0 | 0.6 | 24.0 | 2.2 |
| Black, not Hispanic | 15.8 | 0.4 | 40.0 | 3.4 |
| Hispanic | 14.6 | 0.3 | 15.3 | 2.7 |
| Other, not Hispanic | 6.9 | 0.2 | 5.0 | 1.0 | Race and Ethnicity and LGBTQI+ |
| White, not Hispanic | 9.0 | 0.3 | 3.3 | 0.6 |
| Black, not Hispanic | 1.9 | 0.2 | 4.5 | 2.3 |
| Hispanic | 2.9 | 0.2 | 3.4 | 1.3 |
| Other, not Hispanic | 1.3 | 0.1 | 0.8 | 0.4 | Race and Ethnicity and Other |
| White, not Hispanic | 0.9 | 0.1 | 0.6 | 0.3 |
| Black, not Hispanic | 0.3 | 0.1 | 0.7 | 0.7 |
| Hispanic | 0.6 | 0.1 | 0.5 | 0.5 |
| Other, not Hispanic | 0.3 | 0.1 | 0.0 | 0.0 | Race and Ethnicity and Did not Respond to LGBTQI+ |
| White, not Hispanic | 0.5 | 0.1 | 0.3 | 0.1 |
| Black, not Hispanic | 0.2 | 0.1 | 0.2 | 0.1 |
| Hispanic | 0.6 | 0.1 | 1.1 | 1.3 |
| Other, not Hispanic | 0.2 | 0.0 | 0.1 | 0.1 |
| Source: U.S. Census Bureau Household Pulse Survey 2021 (Weeks 34–40) linked with U.S. Department of Housing and Urban Development (HUD) 2021 administrative data on public and assisted housing programs. The U.S. Census Bureau reviewed this data product for unauthorized disclosure of confidential information and approved the disclosure avoidance practices applied to this release. CBDRB-FY22-POP001-0058. | ||||
Conclusion
As HUD continues to advance equity across its policies and programs, researchers and policymakers must consider the unique experiences of LGBTQI+ households in the marketplace. Understanding those needs starts with the ability to see the LGBTQI+ community in federal surveys and administrative datasets. Recent advances in federal survey instruments that include SOGI questions have helped promote that visibility, which gives us a particular insight into who resides in HUD programs. We hope that future research into the housing experiences of the LGBTQI+ community will help advance the cause of LBGTQI+ equality, mitigate the effects of generations of discrimination, and improve the lives of America’s SGM population.
Until recently, the sexual and gender minority (SGM) population has been marginalized in many research communities. The exception is the healthcare and public health community, which increasingly has included survey questions about sexual orientation and gender identity (SOGI) over the past decade. Notably, in 2011, the Institute of Medicine (now the National Academy of Medicine) recommended that clinical settings include SOGI questions to systematically document and address health disparities among the SGM population. The nation’s largest population health, the National Health Interview Survey, has included sexual orientation data since 2013, but it still does not include questions about gender identity. Despite recent advances in the use of SOGI questions, many research communities have yet to systematically adopt and embrace their use.
In 2021, the U.S.Census Bureau (Census) started exploring the use of SOGI variable in its surveys. Notably, Phase 3.2 of the Census Household Pulse Survey added questions about sexual orientation and gender identity. The survey includes four SOGI questions that allow HUD researchers to better understand the relationship between SOGI and housing insecurity.
Census Household Pulse Survey, Phase 3.2: Sexual Orientation and Gender Identity (SOGI) Questions
| Question | Response Options |
|---|---|
| D6. What sex were you assigned at birth on your original birth certificate? |
|
| D7. Do you currently describe yourself as male, female or transgender? |
|
| D8. Just to confirm, you were assigned "{D6 Response}" at birth and now you describe yourself as "{D7 Response}". Is that correct? |
|
| D9. Which of the following best represents how you think of yourself? |
|
Source:
It is important to note that varying definitions and iterations of the “LGBTQI+” terminology are widely accepted across multiple sectors. ×
Source:
Caitlin Rooney, Charlie Whittington, and Laura E. Durso. 2018. “Protecting Basic Living Standards for LGBTQ People,” Center for American Progress. ×
Source:
Diane K. Levy, Douglas A. Wissoker, Claudia Aranda, Brent Howell, Rob Pitingolo, Sarale H. Sewell, and Robert Santos. 2017. “A Paired-Testing Pilot Study of Housing Discrimination against Same-Sex Couples and Transgender Individuals,” Urban Institute; Kristie L. Seelman. 2014. "Transgender individuals’ access to college housing and bathrooms: Findings from the National Transgender Discrimination Survey," Journal of Gay & Lesbian Social Services 26:2, 186–206; Samia Addis, Myfanwy Davies, Giles Greene, Sara MacBride‐Stewart, and Michael Shepherd. 2009. "The health, social care and housing needs of lesbian, gay, bisexual and transgender older people: A review of the literature." Health & Social Care in the Community 17:6, 647–58; Van Yu. 2010. "Shelter and transitional housing for transgender youth." Journal of Gay & Lesbian Mental Health 14:4, 340–5. ×
Source:
Although the introduction of SOGI questions into national surveys has been a step in the right direction to promote diversity and inclusion, qualitative research suggests that SOGI questions are not sufficiently representative. Notably, extant SOGI data do not capture identity fluidity and complexity, and SOGI questions and response categories do not clearly align with SOGI dimensions (see Suen et al., 2020). More research is needed to understand how national surveys can better promote inclusion and participation of the SGM population. Another limitation is that the Household Pulse Survey only asks SOGI questions of survey respondents, meaning that these estimates likely underestimate the prevalence of LGBTQI+ households. Finally, when examining intersections, limited sample size can lead to unstable estimates, especially in the “did not respond” category (as shown in error bars in figures). ×
Source:
In the Household Pulse Survey, there is no set rule on who the respondent should be. The Census sends invitations to the email and/or phone number attached to the sampled housing unit. ×
Source:
Defined as renter households in which the respondent answered “No” to the question, “Is this household currently caught up on rent payments?” ×
Source:
Defined as renter households in which the respondent answered “Very Likely” or “Somewhat Likely” to the question, “How likely is it that your household will have to leave this home or apartment within the next two months because of eviction?” This question is posed only to households who report being behind in rent. ×
Source:
Basolo, Victoria, and Mai Thi Nguyen. "Does mobility matter? The neighborhood conditions of housing voucher holders by race and ethnicity." (2005): 297-324; U.S. Department of Housing and Urban Development. “Affordable Housing/Worst Case Needs Reports to Congress.” Accessed 16 February 2022; Frederick J. Eggers. 2020. “Characteristics of HUD-Assisted Renters and Their Units in 2017,” U.S. Department of Housing and Urban Development. ×
Source:
“LGBTQI+ renter households” are defined as renter households in which (1) the respondent reported their sexual orientation as “gay or lesbian,” “bisexual,” or “something else,” or (2) the respondent reported their gender identity as “transgender” or “none of these.” “Other renter households” are defined as households in which (1) the respondent reported their sexual orientation as “I don’t know,” or (2) the respondent’s nonimputed sex assigned at birth (male or female) is different from their gender identity (male or female) and their sexual orientation is “straight.” “Did not respond” renter households are defined as households in which the respondent saw the question but did not select a category for either sexual orientation or gender identity. “Non-LGBTQI+ renter households” are defined as households in which the respondent reported their sexual orientation as “straight” and their gender identification as “male” or “female.” ×

